
Introduction: A Bus Stops, the City Waits — Then It Doesn’t
I remember standing at a busy depot, watching drivers swap schedules because a bus needed an unexpected top-up — that little chaos is the reality we try to fix. A pantograph charger sits on the roof, slides up, and in minutes restores range; adoption climbed roughly a third last year as fleets chased faster turnaround and lower dwell time. So here’s the question I keep asking: can we make that rooftop handshake as predictable as a traffic light? (Spoiler: yes, but it takes fixing more than just hardware.)
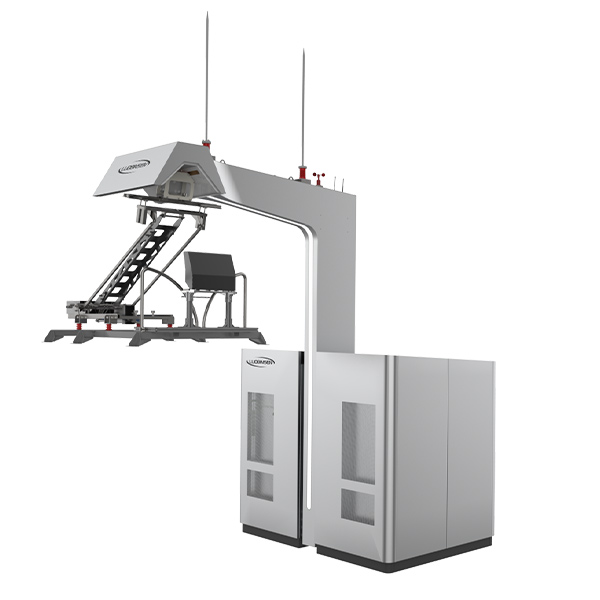
I’ve been in transit projects long enough to know the math matters — energy throughput, mean time between failures, peak load windows — yet the story is always human: drivers, schedulers, city planners. We need solutions that speak both languages. Let’s walk from a depot-level problem to practical choices — no fluff, just what I’ve seen work and why it matters.
Part 2 — What’s Broken: The Hidden Flaws of Pantograph Charging Stations
When we focus on a single product — say, a pantograph charging station — it’s easy to assume the rest will fall into place. In reality, several systemic issues trip up deployments: mismatched communication protocols between vehicle telematics and the charger; insufficient load management during peak hours; and power converters that overheat under rapid cycling. These are technical points, but they translate directly into real pain: buses delayed, maintenance windows stretched, and angry riders. Look, it’s simpler than you think — these failure modes are predictable once you start measuring.
Let me break this down technically: first, the interface layer. Many chargers and buses use different communication stacks, so handshake failures become common (CAN bus vs. OCPP adaptations — yes, they matter). Second, energy flow and thermal design. Rapid charging pulses stress power electronics and demand robust cooling and filtering; otherwise you hit derating thresholds and reduced availability. Third, operations: without integrated load forecasting and smart scheduling, chargers create local grid peaks that trigger utility penalties or brownouts. I’ve seen projects where a single suboptimal control strategy cut availability by 20% — and that was avoidable. — funny how that works, right?
How do users actually suffer?
Drivers face inconsistent charge times; depot managers deal with unexpected maintenance; fleet planners lose faith in scheduling models. The hidden cost here isn’t just replacement parts — it’s trust and planning momentum. Two industry terms that matter when you dig in: catenary interface and DC fast charging controls. Address those, and you remove the biggest friction points.
Part 3 — Looking Forward: Principles and Metrics for Better Pantograph Bus Charging
Now let’s look ahead. I prefer a principles-first approach: reliability, interoperability, and grid-aware control. New installations should be designed around modular power electronics, real communication standards, and predictive maintenance. For example, integrating onboard diagnostics with the depot’s energy management system reduces downtime and helps smooth demand peaks. We’ve piloted systems where predictive alerts decreased unscheduled service by nearly a quarter — I’d take that result to any city council meeting.
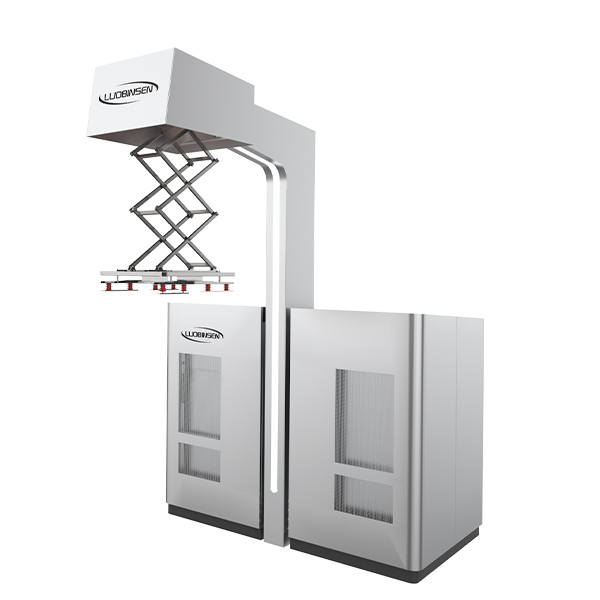
On the technology side, consider edge computing nodes at the charger for local decision-making (reduce latency), and advanced power converters that handle fast ramp-ups without thermal derating. When you plan for pantograph bus charging — yes, pantograph bus charging — you also need to factor in grid services: can the depot provide demand response or battery buffering? That shifts the conversation from cost centers to flexible assets (and—unexpectedly—new revenue streams).
What’s Next?
Here are three practical metrics I recommend for evaluating solutions: 1) Effective Availability — percentage of scheduled charging sessions completed on time; 2) Energy Throughput per Charger — kWh delivered per operational hour (shows real productivity); and 3) Mean Time to Repair (MTTR) — average downtime after a failure. Use those to compare vendors and designs. I’m blunt about this because I’ve seen glossy specs hide poor operational numbers.
In closing, I’ll say this plainly: building a resilient pantograph ecosystem requires more than a box on the roof. It takes thoughtful integration, clear communication standards, and operators who treat chargers as part of a larger energy and mobility system. I’m optimistic — the tech is maturing, and with the right metrics and mindset, we can make urban electric transit reliably convenient. — funny how that works, right? For sensible, tested options, check out Luobisnen.
